Research
Satellite Remote Sensing
I use satellite remote sensing to look at water temperature, ocean currents, ice cover, and primary production. Many of these datasets go back decades. We can look at primary production back to 1997 and sea ice distribution all the way back to 1978. These longterm records provide us with a powerful (and free!) tool to examine changes in the polar regions, allowing us to bring decades of data to bear on emergent questions.
Argo Float Network
The Argo float network consists of almost 4,000 autonomous profiling floats that collect ~140,000 water column profiles each year. In the polar oceans over 100,000 individual profiles have been collected since the beginning of the program. Many of these floats have additional sensors that measure pH, nitrate, oxygen, and phytoplankton abundance. This network of floats is growing rapidly and the measurements they collect provide essential (and free!) data on water column processes in the polar regions.
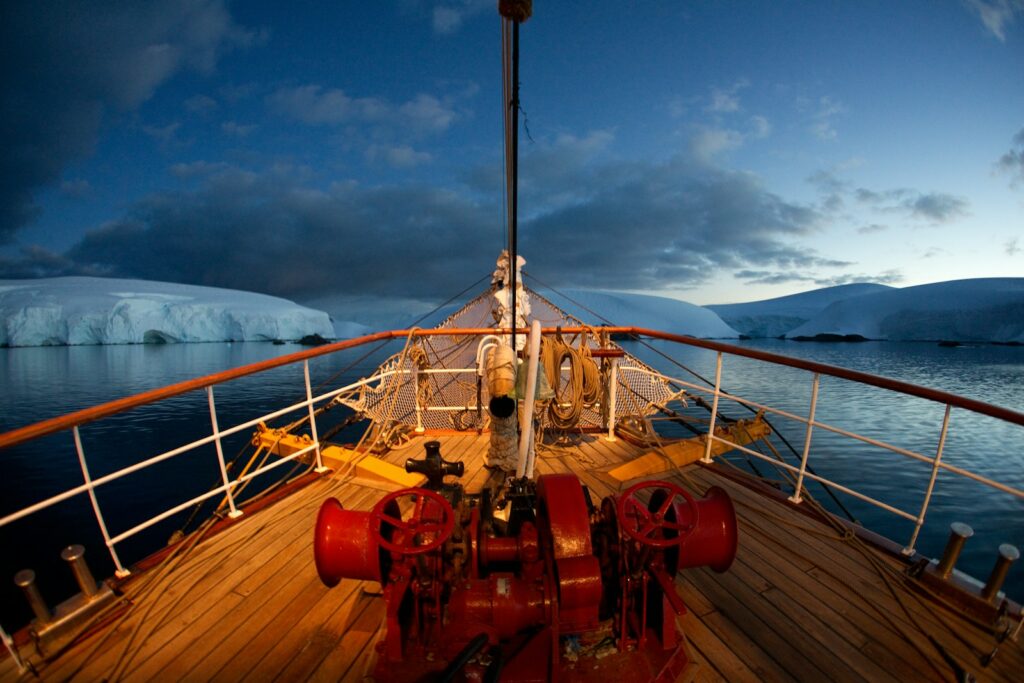
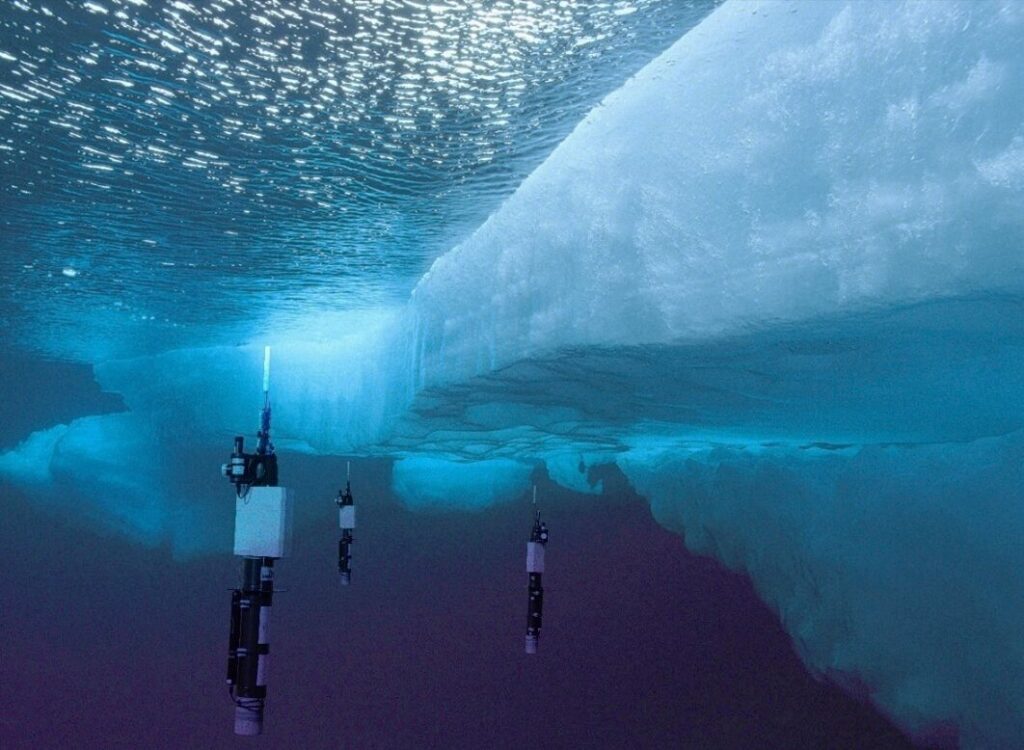
Fieldwork
Fieldwork is my favorite part. I have been on multiple research cruises to the Southern Ocean and the tropical North Atlantic Ocean. Measuring net primary production and phytoplankton photosynthetic processes in situ enables us to put our remote sensing observations in context and provides us with essential information on the details of the processes influencing primary production that we can’t get any other way. This work is very expensive, so when the funding isn’t available to do it, we rely on remote sensing data sets to investigate the polar regions.

Historical cruise data
In the last decade researchers have begun compiling databases with field data from cruises back to the 1970s. Many of these data are from repeat hydrographic lines where the same transect has been sampled several times over the span of decades. These data, paired with satellite remote sensing data, are an exciting tool that can be used to examine changes in the ocean looking back through time with field data in addition to satellite data.
Featured Published Work
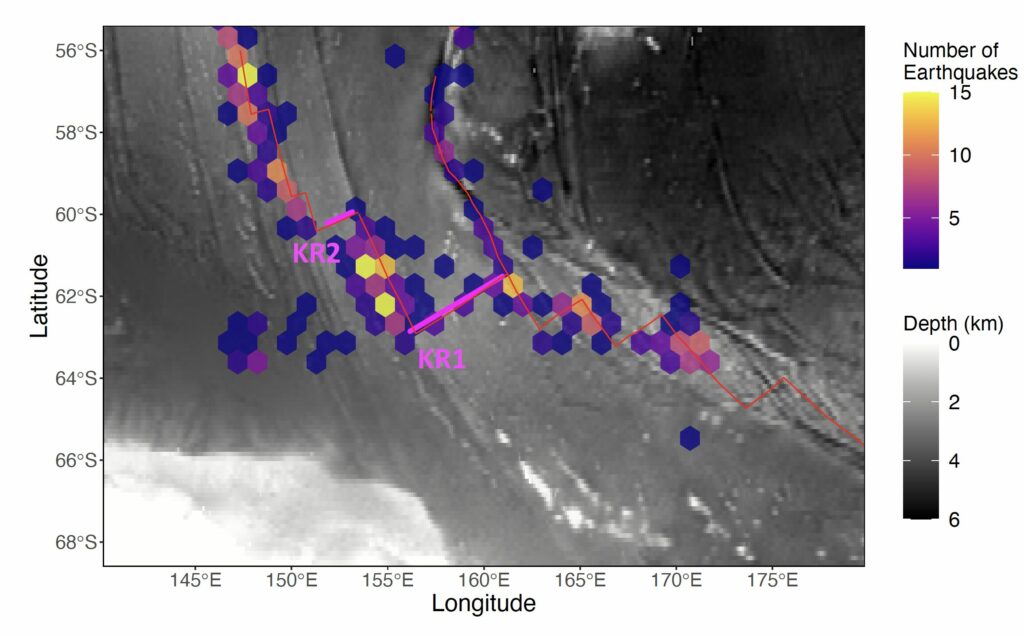
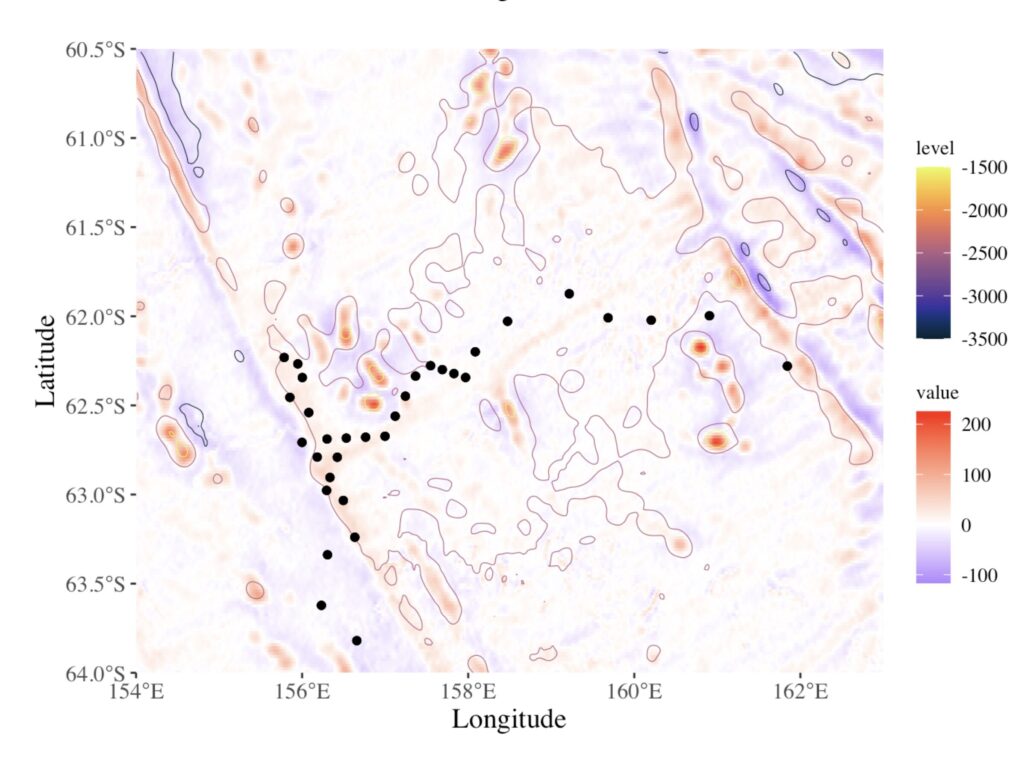
This figure shows earthquake activity along the Australian Antarctic Ridge since 1997. Each hexagon represents the number of earthquakes in that location. The background is bathymetry. The red line is the plate boundary between the Pacific, Australian, and Antarctic plates. The magenta lines are the KR1 and KR2 vent ridges, which are the source of the iron responsible to the recurring phytoplankton bloom in the surface ocean.
Earthquakes predict net primary production in hydrothermally- influenced bloom
This work demonstrates that the interannual variability in net primary production in the Australian Antarctic Ridge bloom can be predicted by earthquake activity and advective spread in the months leading up to the austral growing season. As this bloom is fueled by the iron emitted from hydrothermal vents, we believe earthquake activity is serving as a proxy for changes in hydrothermalism. This is the first report of any connection between earthquake activity and surface net primary production in the ocean, and the short interval between the earthquake activity and changes in surface production suggests a much closer connection between hydrothermal effluent and surface production than previously thought. This work is currently in revision, please contact me if you would like a preprint.
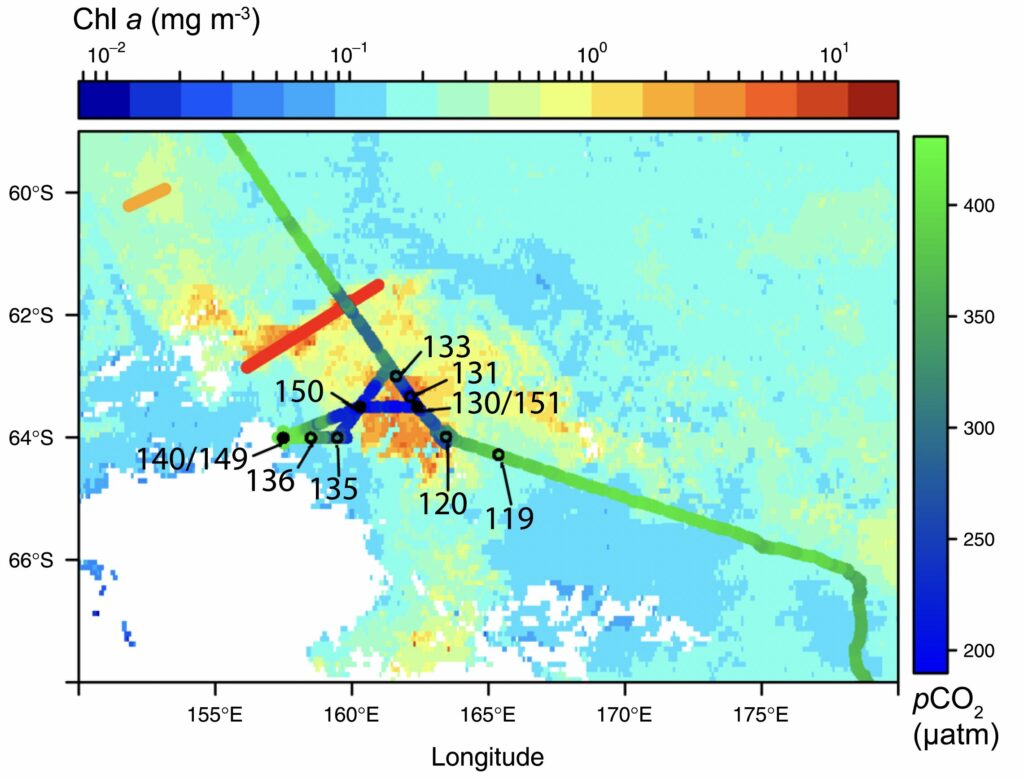
This figure shows the chlorophyll a concentration in the Australian Antarctic Ridge bloom during January 2014 when we sampled the bloom along the transect shown by the line. The KR1 and KR2 vent ridges are shown by the red and orange lines, respectively.
Hydrothermally influenced phytoplankton bloom in the Southern Ocean
We found the first evidence of a recurring phytoplankton bloom resulting from hydrothermal vent emissions in the Pacific sector of the Southern Ocean, in the waters above the Australian Antarctic Ridge (AAR). The bloom results from iron concentrations originating from two hydrothermal vent ridges along the AAR.
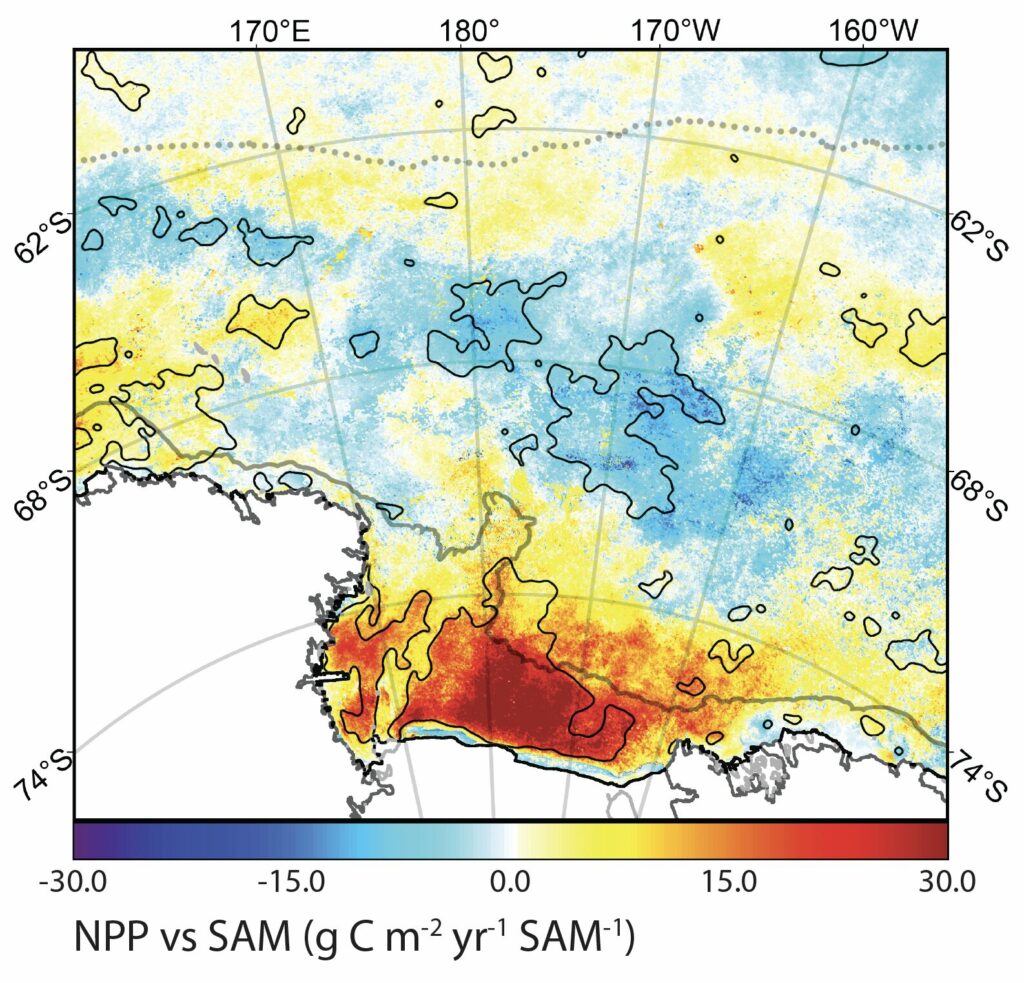
This figure shows the change in net primary production in response to a 1-unit change in the Southern Annular Mode Index. The Antarctic continent is shown in white with the coastline shown in black.
Net primary production in the Ross Sea region of the Southern Ocean
Patterns of NPP in the Ross Sea region are strongly influenced by large-scale atmospheric pressure systems like the El Niño Southern Oscillation and the Southern Annular Mode. The response of NPP to changes in these atmospheric pressure systems is opposite on the shelf in the Ross Sea to what we observe off the shelf in the open ocean.

Bryophytes in the Earth System
Working to add a bryophyte plant functional type to earth system models. Developing a model component to integrate bryophyte water content and photophysiology.
NPP in the Amundsen Sea
Examining the interannual variability of net primary production in the Amundsen Sea. We are looking at the influence of upwelling circumpolar deep water and the coastal current on net primary production in the Amundsen Polynya.
MOR Associated Vertical Circulation
Examining vertical circulation associated with mid ocean ridges in the Southern Ocean using autonomous float data and numerical modeling.